Every second that passes, the world changes. Somewhere, a person is born. Elsewhere, another dies. Millions of emails travel through fiber optic cables. Tons of CO2 dissolve into the atmosphere. Glaciers lose a few more grams. These transformations are continuous, silent, and yet staggering in scale when brought down to a human perspective—that of a minute, an hour, a day.
It is from this premise that Selektroma, in collaboration with Krafsht and RTMKR, conceived Right Now (RGHTNW): a unique, immersive, and minimalist webpage that transforms global statistics into a visceral experience. No complex graphs, no obscure charts—just numbers that increment live from the moment you open the page, reflecting the uninterrupted flow of the real world.
RGHTNW: an idea born in 2019, revamped in 2025
The RGHTNW project isn’t new. Its origins date back to 2019, conceived by startistician, aka RTMKR, with a clear vision: to provide a snapshot of the planet’s statistical pulse. Over the years, the concept has matured, the technology has evolved, and in 2025, Krafsht undertook a complete overhaul of Right Now, modernizing the architecture, enriching the data sources, refining the design, and adding a unique layer of personalization.
The result on RGHTNW is an elegant one-page application, deployed on a standard server, built without a heavy framework or database. Navigation is structured around six thematic sections, accessible via animated vertical scrolling. Each section explores a different dimension of the contemporary world, all linked by the same thread: the passage of time since the page was opened.
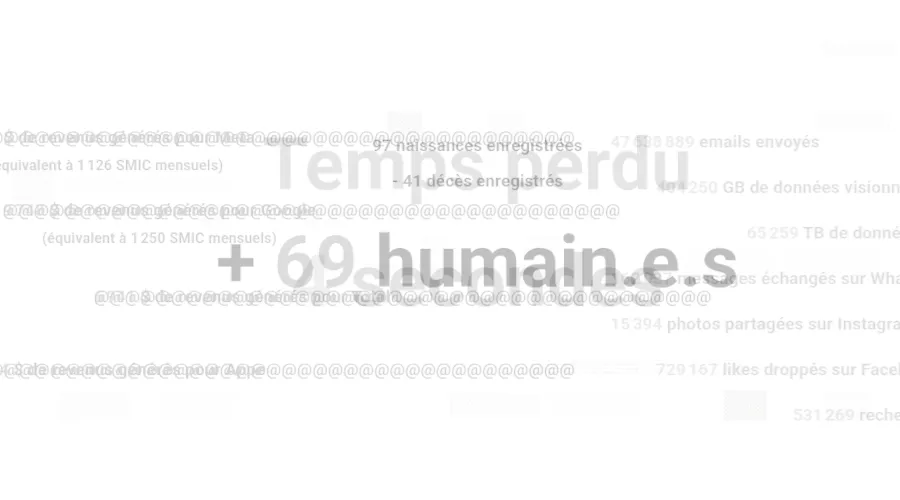
- The first section sets the scene starkly: a large counter displays the number of seconds elapsed since your arrival on the site, simply titled “Lost Time.” This introduction immediately reframes the experience—you’re not here to consume, you’re here to become aware.
- The second section presents the latest searches from Google Trends, retrieved via an RSS XML file that is periodically updated on the server side. What people are searching for right now, in their own language, reveals the current collective obsessions—news, culture, sports, politics.
- The third section delves into the global economy: the revenue generated in real time by Meta, Google, Total, and Apple is displayed and increments by the second. To ground these figures in reality, each amount is translated into the equivalent of a monthly minimum wage—a perspective that makes tangible the wealth gap between these giants and the reality of ordinary work.
- The fourth section paints a picture of internet traffic: emails sent, gigabytes of data streamed, terabytes of data created, messages exchanged on WhatsApp, photos shared on Instagram, likes given on Facebook, and searches performed on Google. These are rates per second, calculated from verified public sources and transformed into a continuous stream by the client’s JavaScript engine.
- The fifth section touches on the most fundamental aspects of humanity: global birth and death rates. Births on one side, deaths on the other, and the resulting net population growth—displayed prominently and in color, reminding us that humanity continues to grow despite everything.
- The sixth and final section turns its attention to the planet itself: CO2 emissions in tons, melted ice, and deforested land area expressed in football stadium equivalents. These are painful figures, but rghtnw.selektroma.fr chooses to display them without excessive dramatization — just facts, leaving the viewer to face their own reaction.
A simple and robust mechanism
Behind RGHTNW’s visual experience lies a deliberately minimalist architecture. Data is stored in static CSV files, each containing a rate of increment per second for each metric. Client-side JavaScript then takes over: as soon as the page loads, an internal counter starts and multiplies the rates by the number of seconds elapsed, continuously updating the display without any additional server calls.
This database-free and real-time API-free approach is both a technical and philosophical choice. It guarantees maximum performance, virtually no maintenance, and robustness in the face of traffic spikes. The only truly dynamic data is the Google Trends feed, updated periodically by a server script. The page background itself is generated programmatically: a script produces a 3840×2160 pixel data-noise ASCII image, executable remotely and randomly. This attention to detail illustrates the project’s philosophy: nothing is left to chance, not even the background.
RGHTNW includes a configuration page accessible from the menu, allowing users to customize their experience. Language (French or English), scrolling speed between sections (slow, normal, fast), enabling or disabling automatic scrolling, and page refresh interval (5, 12, or 30 minutes)—all these settings are saved in sessionStorage and applied on the fly. The page automatically refreshes every 12 minutes by default, ensuring that the data remains fresh without user intervention.
This attention to user experience, rare for a project of this nature, demonstrates an ambition that goes beyond a simple monitoring tool: rghtnw.selektroma.fr is designed to be viewed, displayed as a desktop background in a workspace, projected at an event, or simply opened in the morning to get a sense of the world before starting the day.
Becoming aware, second by second
RGHTNW doesn’t claim to change the world. It aims, more modestly but more effectively, to make it visible. By transforming abstract statistics into a tangible and embodied flow, it invites everyone to grasp the magnitude of what is constantly happening around us: the creation of colossal wealth, the dizzying circulation of data, the slow degradation of life, and the stubborn persistence of humanity, which continues to be born, to love, to search, and to scroll.
A project born from a collaboration between RTMKR and Krafsht, as with “Bots,” RGHTNW demonstrates that data, when properly formatted, can become more than just an Excel spreadsheet. It can become a window.